
1 Research Status of 7xxx Series Aluminum Alloy Extrusion
1.1 Material Characteristics of 7xxx Series Aluminum Alloys
7xxx series aluminum alloys are primarily alloyed with zinc and contain small amounts of magnesium and copper. Super-hard aluminum alloys additionally contain zinc, lead, magnesium, and copper, with hardness approaching that of steel. During extrusion, 7xxx series aluminum alloys exhibit high deformation resistance due to their high alloying content. If the same upsetting pressure used for 6xxx series alloys is applied, the metal cannot fully deform and fill the entire extrusion container. During the degassing stage, gas inside the container cannot be completely discharged, causing gas to become trapped in the product surface during extrusion and resulting in surface pits.
At the same time, 7xxx series alloys are more prone to surface layering defects during extrusion, allowing gas to accumulate within these defects and form surface pits. Compared with 6xxx series alloys, 7xxx series alloys also generate greater friction with die components. These characteristics make the stress conditions acting on die components during extrusion significantly more complex.
1.2 Current Status of Extrusion Die Stress Analysis
At present, stress analysis of aluminum extrusion dies mainly relies on finite element analysis (FEA) methods and theoretical analytical methods. Finite element analysis is currently the most widely used approach. For example, software such as ANSYS can be used to analyze the aluminum extrusion process and obtain the stress and strain fields of both the aluminum billet and die components. By establishing finite element models, stress distribution under different extrusion parameters can be simulated, providing theoretical guidance for die structure optimization and process improvement.
Theoretical analytical methods mainly establish mathematical models to calculate stress distribution during extrusion. Although the calculation accuracy is relatively lower, these methods still provide theoretical support for finite element simulations. Existing studies have shown that stress distribution in porthole dies is uneven, with obvious stress concentration at the root of the mandrel, where cracks are likely to occur and cause premature die failure. Elastic deformation of the mandrel and die bearing area may also lead to dimensional deviation in extruded profiles.
In addition, Inspire Extrude software provides both interpolation and coupled methods for die stress analysis. The interpolation method requires shorter calculation time but can only obtain stress distribution at a single state during one calculation. The coupled method can obtain stress distribution at every stage of the process, although it requires significantly longer computation time and larger storage capacity. Furthermore, interference-fit die structures can introduce pre-stress into die components. Since this internal stress acts in the opposite direction to the stress generated during extrusion, part of the working stress can be offset, thereby reducing die stress and improving die strength.
2 Current Status of 6xxx Series Aluminum Alloy Extrusion Dies
2.1 Structure of 6xxx Series Aluminum Alloy Extrusion Dies
Although 6xxx and 7xxx series aluminum alloys differ in performance, they share certain characteristics. Therefore, the structural design of square-tube extrusion dies for 6xxx series alloys provides useful reference for 7xxx series die design.
The 6xxx square-tube profile adopts a conventional four-port porthole structure. The porthole walls are perpendicular to the welding chamber, and a 30° teardrop-shaped structure is designed at half the bridge height. In the design of the die bearing, bearing length is a key parameter for square-tube forming. According to the tube dimensions, the bearing length at the four corners is designed to be 0.5 mm lower than that of the flat sections. This arrangement reduces friction in slower-flowing areas while increasing friction in faster-flowing areas, thereby promoting profile formation and improving surface quality.
In the lower die design, the welding chamber height is 20 mm, and a pre-chamber with a depth of 0.5 mm is designed between the welding chamber and the die opening. After welding in the welding chamber, the metal flow enters the pre-chamber for secondary deformation, which not only improves the mechanical properties of the profile but also helps balance metal flow.
The back relief of the lower die adopts a two-stage structure, with one relief layer designed every 20 mm and gradually increasing relief dimensions. This ensures sufficient support for the die opening while preventing the extruded profile from contacting or scratching the die components. Considering die strength requirements, the thickness ratio between the upper and lower dies is designed as 1:1.
2.2 Establishment of the Finite Element Model
During model construction, accurate modeling must first be performed according to the actual die dimensions and geometry. A three-dimensional die model can be established using CAD software to ensure model accuracy and completeness, as shown in Figure 1(a). The model is then imported into finite element analysis software for meshing.
Mesh quality directly affects calculation accuracy and efficiency. Tetrahedral meshes are generally used for the die, aluminum billet, and metal flow regions inside the die, while hexahedral meshes are adopted for the bearing region and extruded profile flow region. Local mesh refinement is required in critical areas to improve accuracy. For example, finer meshes are applied near the bearing and porthole regions where stress concentration is significant. To ensure numerical stability and convergence, mesh quality must also be checked and optimized. The finite element model of the 6xxx series extrusion die is shown in Figure 1(b).
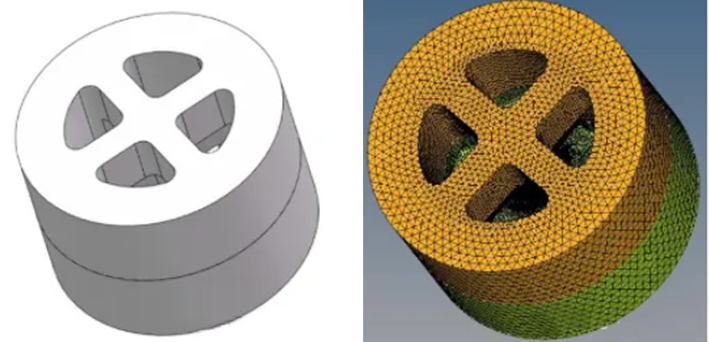
Figure 1 6xxx series aluminum extrusion die model: (a) 3D model; (b) finite element model
2.3 Process Parameters and Boundary Conditions
Since extrusion of 6xxx series square-tube profiles is relatively mature, process parameters commonly used in industrial production were selected, as shown in Table 1.
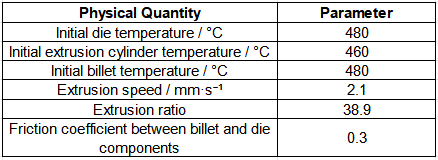
Table 1 Extrusion process parameters
For boundary condition settings, the billet in the billet zone, porthole zone, and welding chamber zone experiences relatively high contact stress. Under these conditions, adhesive friction is applied because adhesion occurs between the billet surface and the contacting die wall.
In the bearing zone, however, contact stress is relatively lower. When friction reaches a certain proportion of the normal stress on the contact surface, sliding occurs, and therefore Coulomb friction is adopted.
The thermal conductivity coefficient between the mandrel and die bearing is set to zero because the temperature difference between the extruded metal and contacting die components is extremely small, making heat transfer negligible.
The inner and outer free surfaces of the profile and the exit region are subjected to convective heat transfer, with a convection coefficient of 50 W/(m²·K). Since these surfaces are directly exposed to air, the typical convection coefficient range is 50–300 W/(m²·K). Because the exact value has little effect on exit temperature and industrial cooling conditions vary, the lower-limit value is uniformly selected.
After assigning boundary conditions and parameters to each surface of the finite element model, the simulation is submitted for analysis.
2.4 Simulation Result Analysis
From the stress analysis results, the maximum stress of the die components appears at the center of the upper die bridge, reaching 648.8 MPa, as shown in Figure 2. This value is lower than the yield strength of the die material.
The results indicate that this die structure possesses good deformation resistance for extrusion production of 6xxx series aluminum profiles, which is consistent with actual production performance. Therefore, this die structure can serve as a reference for designing extrusion dies for 7xxx series aluminum alloys.
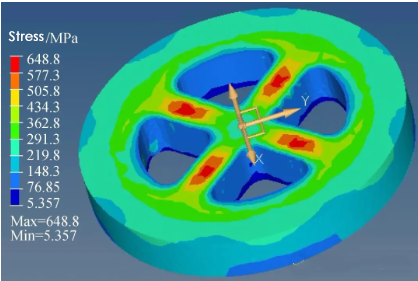
Figure 2 Stress contour of die components
3 Design of 7xxx Series Aluminum Alloy Extrusion Dies
3.1 Die Structure Design
The design of the 7xxx series extrusion die was developed based on the 6xxx series die structure with targeted optimizations.
First, the porthole structure was optimized. According to finite element analysis results, the size, shape, and distribution of the portholes were adjusted to improve metal flow uniformity and reduce local stress concentration. For example, the portholes were designed with a stepped recessed structure, where the closer the location is to the die center, the greater the recess depth. Smooth transition geometries were also adopted to avoid sharp corners. These modifications improve metal flow through the portholes, reduce stress concentration, decrease friction between the alloy and die components, and lower extrusion force.
For the mandrel and die opening design, higher assembly precision was adopted to ensure stable metal flow during extrusion. Advanced machining technologies such as CNC machining were employed to improve dimensional accuracy and reduce dimensional deviation.
In addition, the mandrel geometry was optimized to better match metal flow characteristics. For example, a streamlined mandrel design reduces flow resistance during extrusion and decreases die stress caused by uneven flow. Based on the above optimization measures, the two-dimensional structure of the 7xxx series extrusion die is shown in Figure 3.
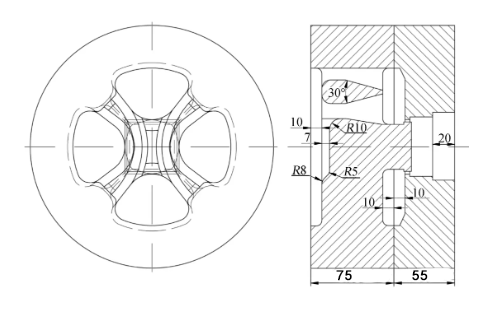
Figure 3 Two-dimensional structure of the 7xxx series aluminum extrusion die
3.2 Extrusion Process Design
To analyze the relationship between internal die stress and extrusion speed, all temperature parameters were fixed at the same values used for the 6xxx series extrusion die.
The extrusion speed range was set to 0.1–2.1 mm/s, with one sampling point every 0.2 mm/s, resulting in a total of 11 groups of process data.
3.3 Establishment of the Finite Element Model
Based on the newly designed 7xxx series extrusion die, 3D software was used to create the upper and lower dies separately, which were then assembled into a complete geometric model, as shown in Figure 4(a).
The 3D model was imported into finite element software for preprocessing. To accurately simulate the extrusion process, local mesh refinement was applied during meshing. The mesh size near the die opening was minimized, while the surrounding mesh gradually increased layer by layer toward the outer regions. This approach better reflects the actual extrusion process and improves simulation accuracy.
Tetrahedral meshes were used, as shown in Figure 4(b). The profile extension length was set to six times the bearing length. The ALE algorithm used by the finite element simulation software enabled accurate analysis of the stress state once steady-state extrusion was achieved.
H13 hot-work die steel was selected as the die material, while AA7004 aluminum alloy was used for the billet. The physical properties of the extrusion billet are listed in Table 2, with parameters obtained from the software material database.
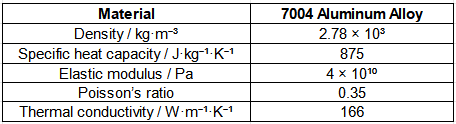
Table 2 Physical property parameters of the extrusion billet
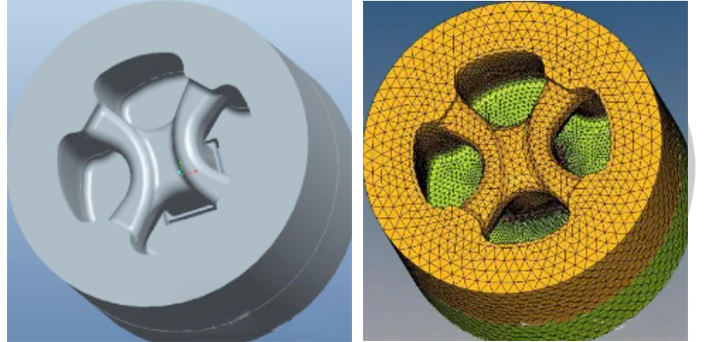
Figure 4 7xxx series extrusion die model: (a) 3D model; (b) finite element model
3.4 Finite Element Analysis Data Collection
Using the above finite element model, simulations were conducted at different extrusion speeds, and the maximum stress values of the die components were collected. According to the designed speed range, one sampling point was taken every 0.2 mm/s. The corresponding extrusion speeds and maximum stress values are listed in Table 3.
The working temperature of the die ranged from 450 to 550 °C. Under this temperature range, the yield strength of H13 steel decreases significantly. When the extrusion speed reached 2.1 mm/s, the maximum die stress approached the material yield strength.
Among all sampling points, three representative extrusion speeds — 0.1 mm/s, 0.9 mm/s, and 2.1 mm/s — were selected for detailed analysis. The corresponding stress contours are shown in Figure 5.
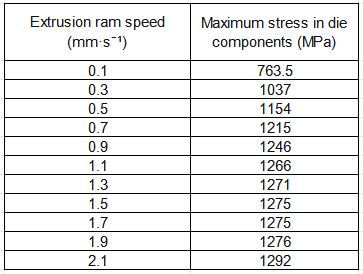
Table 3 Speed–stress sampling values
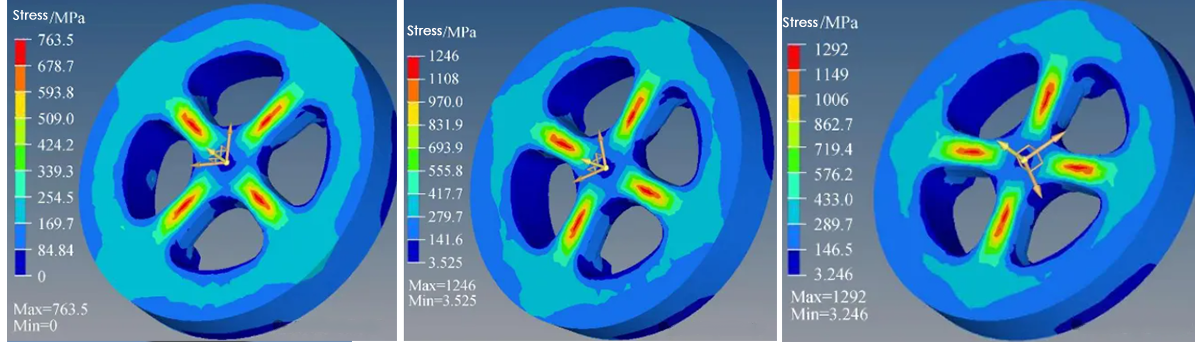
Figure 5 Stress contours of die components at different extrusion speeds: (a) 0.1 mm/s; (b) 0.9 mm/s; (c) 2.1 mm/s
3.5 Stress–Velocity Distribution Curve
As shown in Table 3, the maximum stress of the die components continuously increases with extrusion speed, although the increase is not proportional. To clearly illustrate the numerical relationship between the two variables, a stress–velocity distribution curve was plotted based on the data in Table 3, as shown in Figure 6.
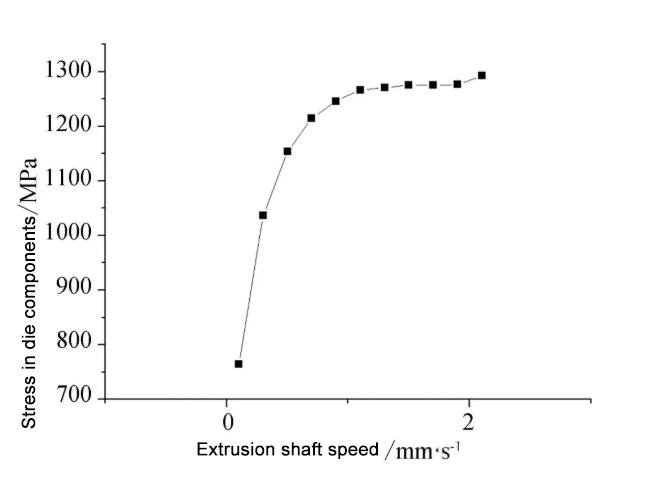
Figure 6 Stress–velocity distribution curve
Figure 6 shows that when the extrusion speed is between 0.1 and 1.0 mm/s, the stress variation of the die components changes significantly. As the extrusion speed continues to increase, the growth rate of die stress gradually decreases. The overall curve exhibits a trend similar to that of a quadratic function.
Post time: May-30-2026


