
Defects that compromise the final profile performance originate from two main sources: on the one hand, billet skin contamination or tail-end defects; on the other hand, so-called transverse welds, which are generated when multiple billets are extruded sequentially to produce a continuous output profile. At the end of each extrusion stroke, when a new aluminum billet is loaded into the press, the die is still completely filled with material from the previous billet. Their interaction generates a transition zone that can extend over a variable length. Because the material reconnects behind the die cavity, seam welds are formed in hollow profiles. Charge welds are also formed under high hydrostatic pressure, but unlike seam welds, they are usually contaminated by oxides, dust, or lubricants introduced when loading the billet into the press. When die design and the extrusion process are properly optimized, seam welds can exhibit mechanical resistance comparable to that of the base material. However, due to their inferior mechanical properties, the entire profile length affected by charge welds must be scrapped.
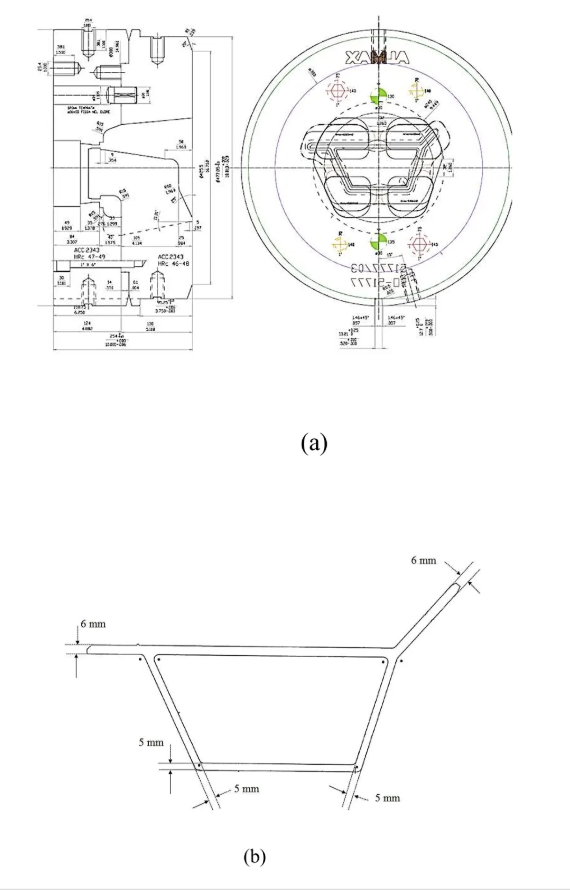
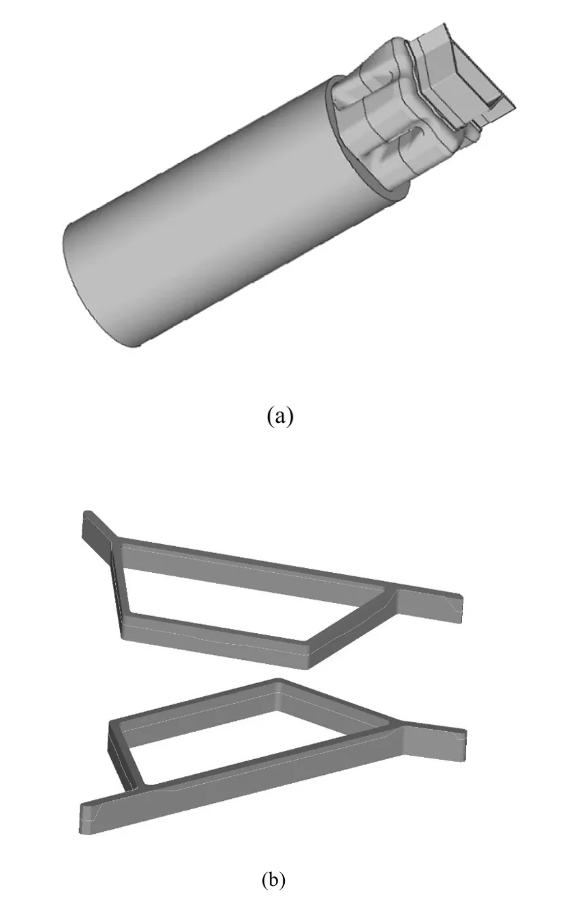
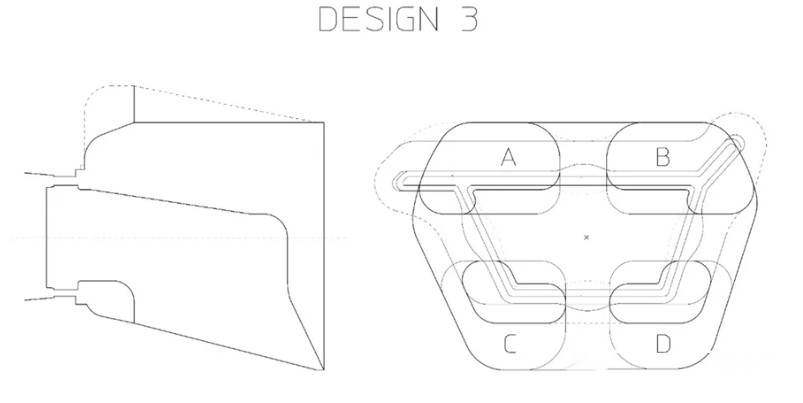
The die design, shown in the figure below, features four portholes and is intended for the production of a hollow profile for lightweight panels. The profile has a bottom thickness of 5 mm and an upper thickness of 6 mm. Relative to the die position in the press, it presents two flat protrusions on the upper part of the profile. The internal cavity of the profile is formed by a mandrel supported by four bridges, leading to the formation of seam welds: two located at the middle of the long horizontal sides and two at the middle of the inclined sides. The cross-sectional area of the profile is 2496 mm², and the maximum bearing length on the outer surface is 20.5 mm. The porthole design and manufacturing were aimed at minimizing the aluminum volume within the portholes, thereby reducing the extension of the weld seams.
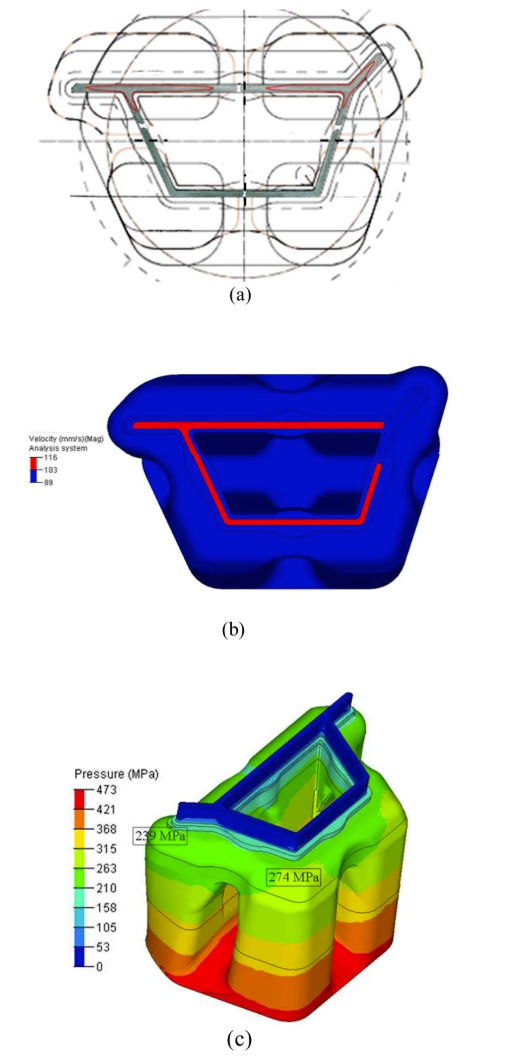
b) Finite element simulation results expressed in terms of profile exit velocity [mm/s], and
c) pressure map [MPa].
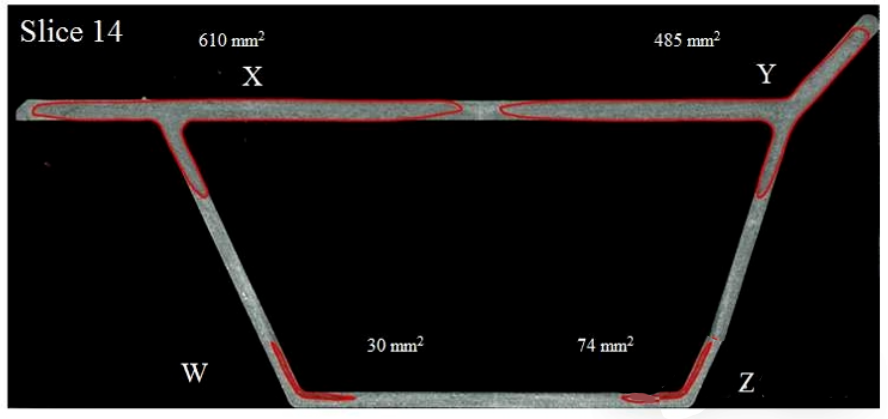
The figure shows the experimental evolution of the weld seams within the profile at increasing distances, illustrated in four steps. Figures 6a and 6b show, respectively, 4% and 32% replacement of the old material by the new billet. The new billet appears on the upper side of the profile (flows X and Y) as two small closed loops, corresponding to the thicker side. Compared to flow X, flow Y is only slightly delayed; in fact, at slice 11, the measured flow areas of X and Y are almost identical, equal to 402 mm² and 383 mm², respectively. It can be observed that both flows (X and Y) converge toward the central seam weld at the same speed. The third flow (Z flow) appears from the lower right region, followed shortly by the W flow, while the thicker upper section has not yet been completely replaced. At slice 33, it is clearly visible that almost no trace of the charge weld remains within the profile.
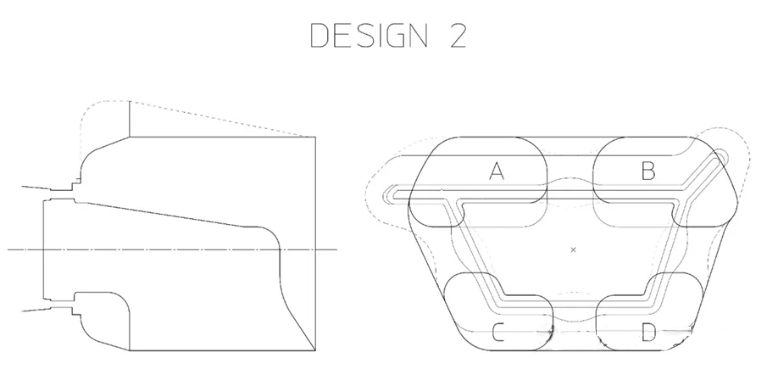
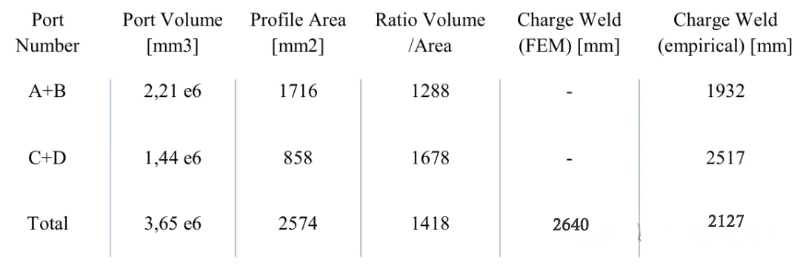
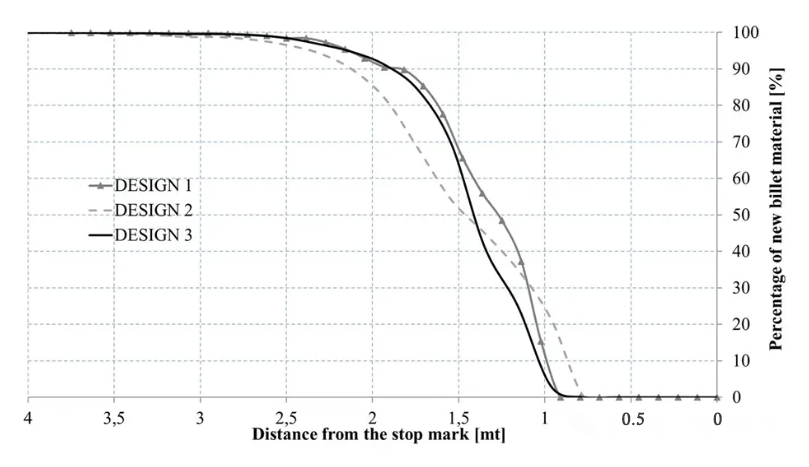
In other words, the influence of dead metal flow in DESIGNS 2 and 3 can be clearly noted. Although the volume of portholes C + D is similar in DESIGN 2 and DESIGN 3, DESIGN 3 exhibits the lowest percentage of dead metal flow. The dynamic compression of the flow in DESIGN 3 allows dead metal flow to be minimized. Compared to DESIGN 1, portholes C and D are reduced with a tapered shape, but their volume is almost identical to that in DESIGN 2. Detailed information for DESIGN 3 is reported in the table. When comparing the calculated charge weld length of DESIGN 3 with that of DESIGN 2 (2640 mm versus 3160 mm), the effect of porthole shape becomes evident. One of the results of porthole reshaping is a re-sizing of the welding chamber, maintaining its height while reducing its width, which is also beneficial in terms of pressure and seam weld quality.
It can be concluded that the reduction of charge weld extension is not merely a matter of reducing porthole volume, since the modified porthole shape has a significant effect on reducing the local weld extension in portholes C and D. This is because DESIGN 3 maintains the same porthole volume for C and D as in DESIGN 2, while increasing the inlet area, thereby avoiding the reduction of the profile feeding area observed in DESIGN 2. The success of DESIGN 3 relative to DESIGN 2 is therefore attributable to porthole shape rather than volume. Even though, in DESIGN 3, the flow velocity through portholes A and B (feeding the longer side of the profile) is reduced compared to DESIGN 2, and the flow through the shorter side is accelerated, the overall effect is a more balanced replacement at the die exit. Consequently, material scrap is reduced from 2750 mm in DESIGN 1 to 2640 mm in DESIGN 3.
• A cylindrical reduction of porthole volume in asymmetric profiles leads to flow imbalance and an increase in charge weld extension.
• Dynamic compression of the flow in tapered portholes, without changing the global volume, results in a shorter transition zone.
• Empirical formulas reported in the literature are not suitable for predicting the amount of material scrap.
• The extension and pattern of charge welds predicted by finite element codes are not influenced by the main process parameters (ram speed and billet preheating temperature) or by the extruded aluminum alloy.
Post time: Jan-01-2026


